Scaling Your World
Project Description
The Scaling Your World project was made to help us students understand the different topics within congruency, dilation, and shapes. The main focus was dilation, which is a transformation of a shape into a different size. The purpose was so that we would learn how to scale objects down or up, depending on the object.
We first started this project by describing as a class what we already knew about congruence and similarity. After we were all at the same pace, we separated into groups and made posters about different topics within congruence and similarity. Some of the topics we covered throughout the multi-week project was proportional reasoning and the algebra of proportions, polygons and angles, logic reasoning and proof, experiments and data analysis, and mathematical modeling. Within these topics, we had several worksheets in class that helped us understand and think deeper into the subject. The worksheets I accomplished are as follows: Similar Problems - which we had to set up equations to find the lengths of the sides; Inventing Rules - creating ratios to solve for x; Polygon Equations - setting up equations to find side lengths of polygons; Ladder Crossing - an open ended problem that made us calculate how high two ladders cross; Billy Bear Grows Up - rescaling a bear on isometric dot paper to create an equation to find out the perimeter after a long period of time; Repeated Dilations - a series of flags with numerous questions of going back and forth through different flags of various sizes; Enlarging on a Copy Machine - reviewing student views (not peers but in the worksheet) about how to enlarge a logo three times if the biggest enlargement is 200%; Dilation with Rubber Bands - using rubber bands to create a shape and then a similar shape of a different size near it with the tension of a rubber band.
Throughout the project, there were different benchmarks. The first benchmark was a proposal of what we were going to scale down, the second showing our mathematic calculations of how it was being scaled down, the third being the actual model of what we scaled, and the fourth a write-up to include on our digital portfolio.
In December, all of High Tech High North County has an exhibition where we exhibit to the public (which is a majority of our parents) a project that we had been working on that is interactive and represents a bigger picture. Our model, video, or poster will be exhibited then along with another project.
Mathematic Concepts
1. Congruence and Triangle Congruence
Congruency is when two shapes have the same shape and size, or the angles and lengths are the same.
2. Definition of Similarity
Similarity is defined as a certain aspect or look-alike to a shape or object.
3. Ratios and Proportions, including solving proportions
A proportion is the name for two ratios that are equal. A ratio is the relation between two numbers that show the amount of times a value is contained within the other.
4. Proving Similarity: Congruent Angles + Proportional Sides
Congruent angles are when the angles on two shapes match. If the measures of sides that correspond on a shape are the same, then they are proportional sides.
5. Dilation, including scale factors and center of dilation
Dilation is a notation that creates the same shape as the original, but a different size. Scale factors are numbers that scale a quantity. Center of dilation is a point in the plane that is the center for all expansions and contractions.
6. Dilation: Effect on Distance and Area
The effect on distance in dilation depends on how the shape is being dilated because it either shrinks or enlarges the shape, so the distance from the center differs.
Understanding These Concepts:
All of the definitions describe and show what my understanding of the concepts are. The definitions are from what I learned in class from the posters my peers completed.
Connecting Concepts:
The relationship between similarity and proportion is that similarity finds what part of the shapes are similar, whether it is the shape or the size, but proportion examines the ratios of the angles and measures of the sides in the shape.
The relationship between dilation and similarity is that the dilation of a shape compared to the original shape shows similarity of the shapes.
Connection to Benchmark #2:
Benchmark two was for our mathematical component of the project, and this was for us to show how we scaled our product whether it was expanded or contracted. We had to describe the height, shape, or dimensions of the item we were scaling down, and then provide the measurements for the scaled down version. This relates to the math concepts because this benchmark exhibits the dilation of our object, the similarity, proportions, and congruence.
Connection to Benchmark #3:
Benchmark three was our actual product, which for my group, was two cakes. The connection between the math concepts and the third benchmark is that you have to have the correct math information. Scaling a cake is hard because cutting the recipe in half and then into a third means some ingredients has to be split in half.
Exhibition
The first benchmark involved mainly a proposal of our ideas for a final product and a later on benchmark. We had to describe what we would be scaling, whether or not it was being scaled down or up, and if we were completing the project individually or in a group. I worked in a group, and we decided to scale a cake. We scaled it down to make a miniature cake.
The second benchmark was a document of all of our calculations for what we were scaling. We had to include the original measurements and then how we scaled it down and what the final measurements were. For my group, we took a recipe and divided it in half, but then because we had to calculate the volume and height of the cake we scaled it so it was ⅓ the original recipe. The table we made with calculations along with the volume and dimensions is located at the end of this section.
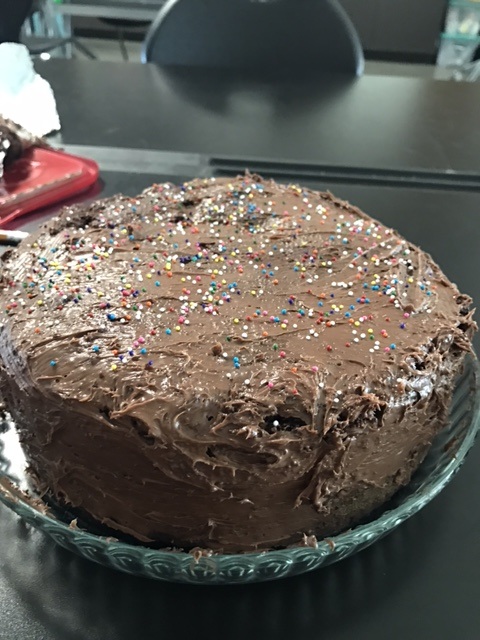
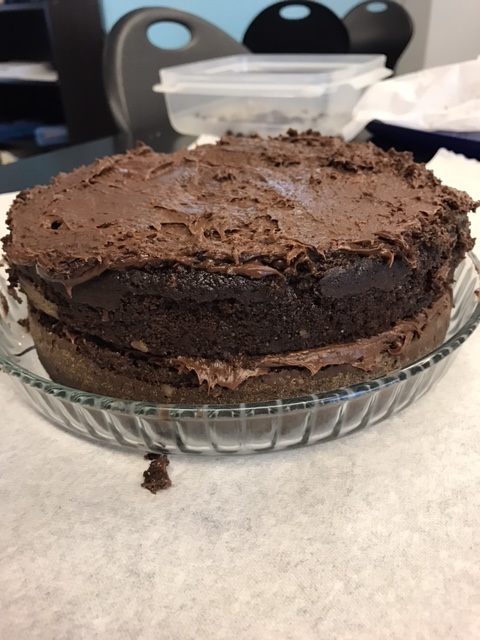
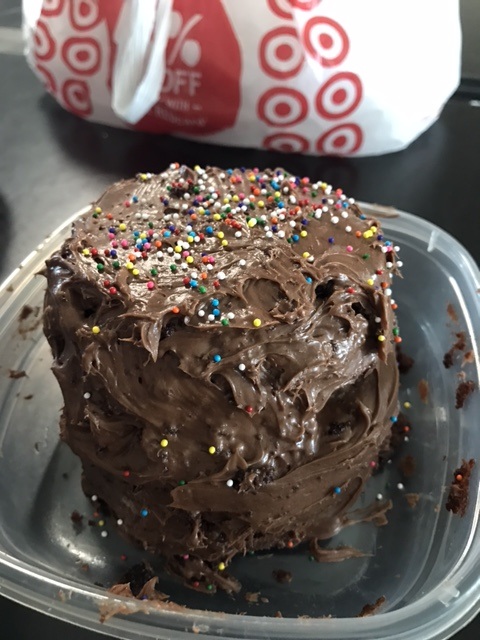
The third benchmark was the complete scaled product. If the product wasn’t easily transportable, we had the option of making a poster or a video. For my group, we were going to make a video but unfortunately could not all get together to bake the cake. Instead, one person made the normal cake, one person made the miniature cake, and one person made the frosting. During lunch on the days leading up to the due date, we assembled the cake and took pictures for our poster. The pictures of our process and final product can be found at the end of this section. It may not look the neatest but it sure was delicious!
The second benchmark was a document of all of our calculations for what we were scaling. We had to include the original measurements and then how we scaled it down and what the final measurements were. For my group, we took a recipe and divided it in half, but then because we had to calculate the volume and height of the cake we scaled it so it was ⅓ the original recipe. The table we made with calculations along with the volume and dimensions is located at the end of this section.
The third benchmark was the complete scaled product. If the product wasn’t easily transportable, we had the option of making a poster or a video. For my group, we were going to make a video but unfortunately could not all get together to bake the cake. Instead, one person made the normal cake, one person made the miniature cake, and one person made the frosting. During lunch on the days leading up to the due date, we assembled the cake and took pictures for our poster. The pictures of our process and final product can be found at the end of this section. It may not look the neatest but it sure was delicious!
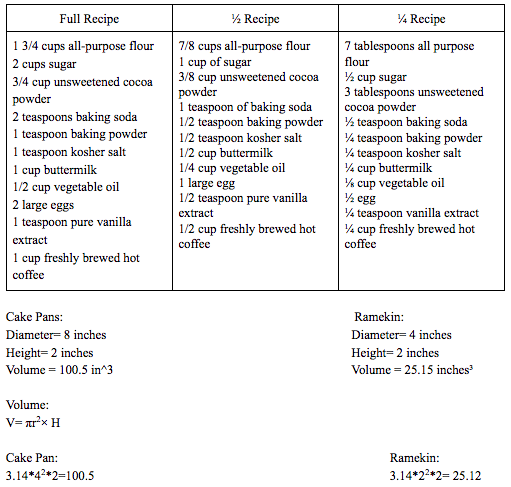
This image is of the calculations. (Benchmark #2)
Below the calculations are the final products on the left and right and in the middle is the process.
Reflection
Throughout the Scaling Your World project, I came across a few challenges, most of which involved a Habit of a Mathematician. This opened of my point of view to believe that all math problems or projects relate (in some way) to a Habit of a Mathematician. One of my challenges was staying organized within my group, which is also a Habit of a Mathematician. We had many papers due and we would always be scrambling to find the correct one that we needed to turn in. To solve this, we assigned a specific person to hold onto a different assignment. This helped us stay organized and not get confused or messy before a benchmark or worksheet was due. Another challenge was collaborating and deciding to make a poster instead of a video. The Habit of a Mathematician that goes along with this challenge is Collaborate and Listen. Another group member and I didn’t remember when we decided to make a video and we couldn’t organize a time for us all to meet and make the cake, so we talked as a whole group and decided making a poster would be best for our situation. Each member of my group did their part individually and collaborated well and listened to every idea on the table. Overall, I think this project went smoothly because there weren’t many roadblocks but I still felt challenged, since the topic of dilation was new to me.
